Antivirus Performance Study Shows Diversification is Key
OPSWAT has two multi-scanning products, Metascan® and Metascan Online, that both demonstrate the importance of using more than one antivirus engine to detect threats – the more you have, the greater the range of protection. A single anti-malware engine cannot guarantee 100% detection of threats. However, what one engine doesn’t detect, may be detected by another engine. In this way, one engine’s weaknesses can be another engine’s strength.
These strengths and weaknesses can change on a daily basis as well as over longer periods of time. Some engines may spend more time improving their detection of threats, speed, or overall performance compared to other engines on the market. This is why multi-scanning is so important – not all engines are created equal.
To show a few examples of this reasoning, we pulled data from AV-Test, Virus Bulletin and AV-Comparatives, three leading testing organizations that evaluate anti-malware software. Since comparing the quality of different antivirus engines can often be a challenge, we decided to include three different testing organizations, as each has its own unique methodologies for evaluating antivirus vendors (reference links found at the end of this post). To do this, we looked at their data and observed antivirus engine rankings over the last couple years. Our goal was to see how vendors have performed over time and to look at how their rankings have changed each year. This allowed us to evaluate the engines collectively, rather than separate – alleviating the need to constantly reevaluate the effectiveness of each engine and instead allowing us to focus on the aggregate detection rate.
As OPSWAT is vendor agnostic, we decided to list the names of antivirus vendors anonymously, in order to refrain from explicitly promoting specific vendors. We then color coded the engine names and replaced them with Greek letters. We reassigned the names for each testing organization and used the following numbers to better represent that distinction. For example, vendors represented in the AV-Test will be referred to as Alpha 1, Beta 1, etc., vendors in Virus Bulletin will be Alpha 2, Beta 2, etc., and vendors in AV-Comparatives will be Alpha 3, Beta 3, etc.
Links to each testing organizations’ methodologies are provided at the end of this post.
AV-Test Results
AV-Test has a Protection category in which they rate engines on their ability to ward off real-world attacks such as zero-day malware attacks, email threats and more. We collected data from the previous four years, taking a look at the top five products each year and then separated them into two main categories:
- Home User Products
- Corporate Solutions
In total, there were 10 different vendors represented, which have been color coded and listed anonymously below. It is important to note that not every vendor appeared in each year’s top five results.
For the Home User Products category, we plotted the different vendors in the chart below. Each column is a year and each row represents their relative performance. The charts below show the vendor rankings year to year with pattern lines and without pattern lines. Pattern lines were added to help visualize trends over time.
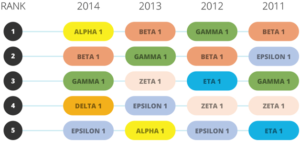
Rankings in the Protection Category, Home User Products (Without Pattern Lines)
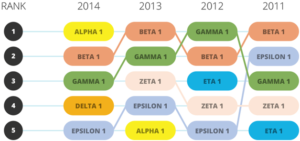
Rankings in the Protection Category, Home User Products (With Pattern Lines)
From the data, we drew pattern lines for four vendors: Beta 1, Gamma 1, Zeta 1, and Epsilon 1. Beta 1 and Gamma 1 took the top spots in 2013 and 2012, respectively. However, neither of them consistently stayed at the top. Instead, both oscillated on taking the top rank. For Zeta 1 and Epsilon 1, both vendors stayed in the top 5, hovering within the top three and top five spots over four years.
We then repeated this process for the Corporate Solution category, as shown below.
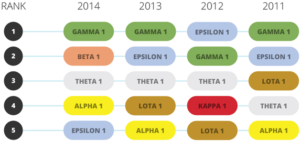
Rankings in the Protection Category, Corporate Solutions (Without Pattern Lines)
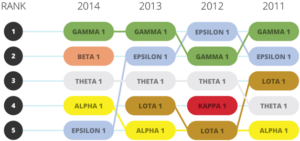
Rankings in the Protection Category, Corporate Solutions (With Pattern Lines)
In the chart above, Gamma 1 and Epsilon 1 switch between the top vendors over the four years represented. From 2011 to 2013, both stayed around the top 2 vendor spots. Theta 1, Iota 1, and Alpha 1 stayed in the top 5 spots.
The data from both categories shows that a vendor’s relative performance fluctuates over time. Combining multiple antivirus products together effectively removes this fluctuation.
Virus Bulletin
Virus Bulletin’s tests are very detailed and sophisticated. They perform tests every two months and cycle through many different operating systems. As mentioned before, you can check the sources listed at the end of this post for more details on how Virus Bulletin conducts these tests.
For simplicity, we selected a single operating system, Windows 7 Professional, and observed its Reactive And Proactive (RAP) results. RAP is used to measure a products’ detection rate for the newest Malware samples available at the time of the product’s test. The test also includes samples that were not seen until after product databases were frozen. The intent is to observe the vendor’s ability to handle a huge quantity of newly emerging malware (proactive) and their accuracy in detecting previously unknown threats (reactive).
This time, there were 14 different vendors represented, spanning across five years. You can see the associations below, using similar color coding with a different set of Greek names.
We plotted the vendor data and again provided one chart with trends lines and one without.
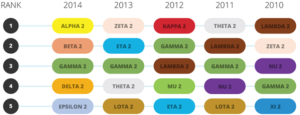
RAP Average Rankings for Windows 7 Professional (Without Pattern Lines)
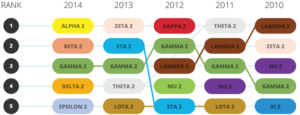
RAP Average Rankings for Windows 7 Professional (Without Pattern Lines)
The chart above is a bit different than the others in this post. This chart includes more vendors, with a fewer number of vendors being consistently listed. One vendor, Gamma 2, is prominent in all 5 years. However, it fluctuates within the top two to top four range. Other vendors such as Eta 2, Iota 2, Lambda 2, and Theta 2, all appear on the top list, but each changes in rank, with the exception of Iota 2, which appears in the top five results in both 2011 and 2013. Apart from Gamma 2, no other vendor consistently appears in the top five rankings each year.
AV-Comparatives
AV-Comparatives has a Performance Test category which evaluates the impact of antivirus software on system performance, how it operates in the background and overall real-time protection capabilities. Over the years, AV-Comparatives has shown as many as 17 vendors in the top rankings. Below, we take a look at the associations and results from this testing organization.
*Note that in 2013 and 2014, the #1 and #2 rank contained more than one vendor
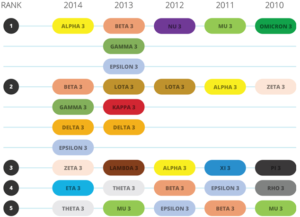
Performance Test Rankings (Without Pattern Lines)
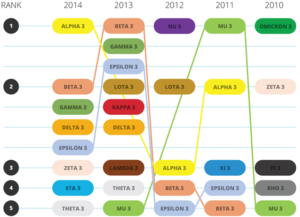
Performance Test Rankings (With Pattern Lines)
The chart above shows the fluctuation of pattern lines over time. The pattern lines for Alpha 3, Beta 3, Epsilon 3, and Mu 3, each tell a different story. For example, Alpha 3 and Mu 3 show the most fluctuation across the five years represented. Alpha 3 goes from #3 to #1, Mu 3 goes from #5 to #1 in 2011, only to drop again to #5 in 2013. Other vendors such as Beta 3 and Epsilon 3 show similar changes. Most importantly, none of the antivirus vendors have consistently appeared within the top 5 rankings over the past five years.
In Summary
To find out whether the top vendor rankings were consistent across the different testing organizations, we looked at the top ranked vendor for each year as identified by each testing organization. Fourteen different anti-malware vendors were represented. Again, we listed the names of vendors anonymously and attempted to draw any pattern lines.
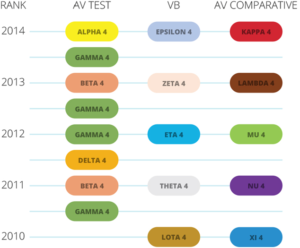
From the above data, we concluded that there was constant change across the three groups, as no pattern lines could be drawn. This supports our claim that no antivirus engine consistently holds the top spot each year across all major testing organizations.
According to these data sets, it is apparent that antivirus products are unable to consistently retain top rankings when examined across several years of testing. Vendor competition in the anti-malware market drives innovation and improvement across all products. The evaluation data provided by these three organizations shows that. One way to overcome these inconsistencies in rankings is by combining multiple anti-malware products together into a single solution. This creates a situation where the constantly evolving nature of competitive products is more quickly translated into customer benefits (ie. higher detection rates).
A similar analogy can be seen through the old adage of investing – diversify your investments (e.g. 60% in riskier stocks with higher ROI and 40% less-risky treasury bills with lower ROI). It’s all based on the premise that when some investments fail, others succeed or remain stable. In other words, you’re not putting “all of your eggs in one basket.” Just as you would do for investing, you should look at multi-scanning as your diversifying solution!
References:
- https://www.av-test.org/en/test-procedures/test-modules/protection/
- https://www.av-test.org/en/test-procedures/test-modules/performance/
- https://www.av-test.org/en/award/
- http://www.av-comparatives.org/dynamic-tests/
- http://www.av-comparatives.org/performance-tests/
- http://chart.av-comparatives.org/awards.php?year=2015 (note: the year can be replaced all the way back to 2009)
- https://www.virusbtn.com/vb100/rap-index.xml
- https://www.virusbtn.com/vb100/about/methodology.xml
- https://www.virusbtn.com/vb100/about/100procedure.xml
- https://www.virusbtn.com/vb100/index


